The Salty Truth
August 29, 2024
OARS River Log | By Ben Wetherill, OARS Water Quality Scientist | Published August 29, 2024
Measuring the March 2024 Salt Flow in Our Watershed

How much salt do we put into our rivers when we salt our roads? Imagine dumping 130 dump trucks of salt into the Assabet or Sudbury rivers in one day.
In the winter and spring months, whenever there is a big thaw or rain event, all of the salt that has accumulated along roadways, parking lots, and sidewalks is washed into the rivers and streams in a sudden flush. Luckily, the high flows carry most of this salt downstream to the ocean, but the amount of salt that is washed into rivers is indicative of a corresponding amount of salt that also percolates into the ground and mixes with groundwater. OARS’ long-term river sampling data show that salt levels in our rivers during the summer months have been steadily increasing as a result of increasing amounts of accumulated salt in groundwater and soils. Some of our smaller streams have chloride concentrations (a road salt component) close to or above chloride toxicity levels for aquatic organisms.
In March 2024, OARS had a unique opportunity to measure the total chloride load in our rivers following a major end-of-winter rain event. With the help of our intrepid volunteers, every March, we collect river water samples at 15 locations around the watershed. This year, it just so happened that our sample collection was scheduled for the day after a very large rainstorm that dropped over 2 inches of rain in 24 hours (see Figure 2).

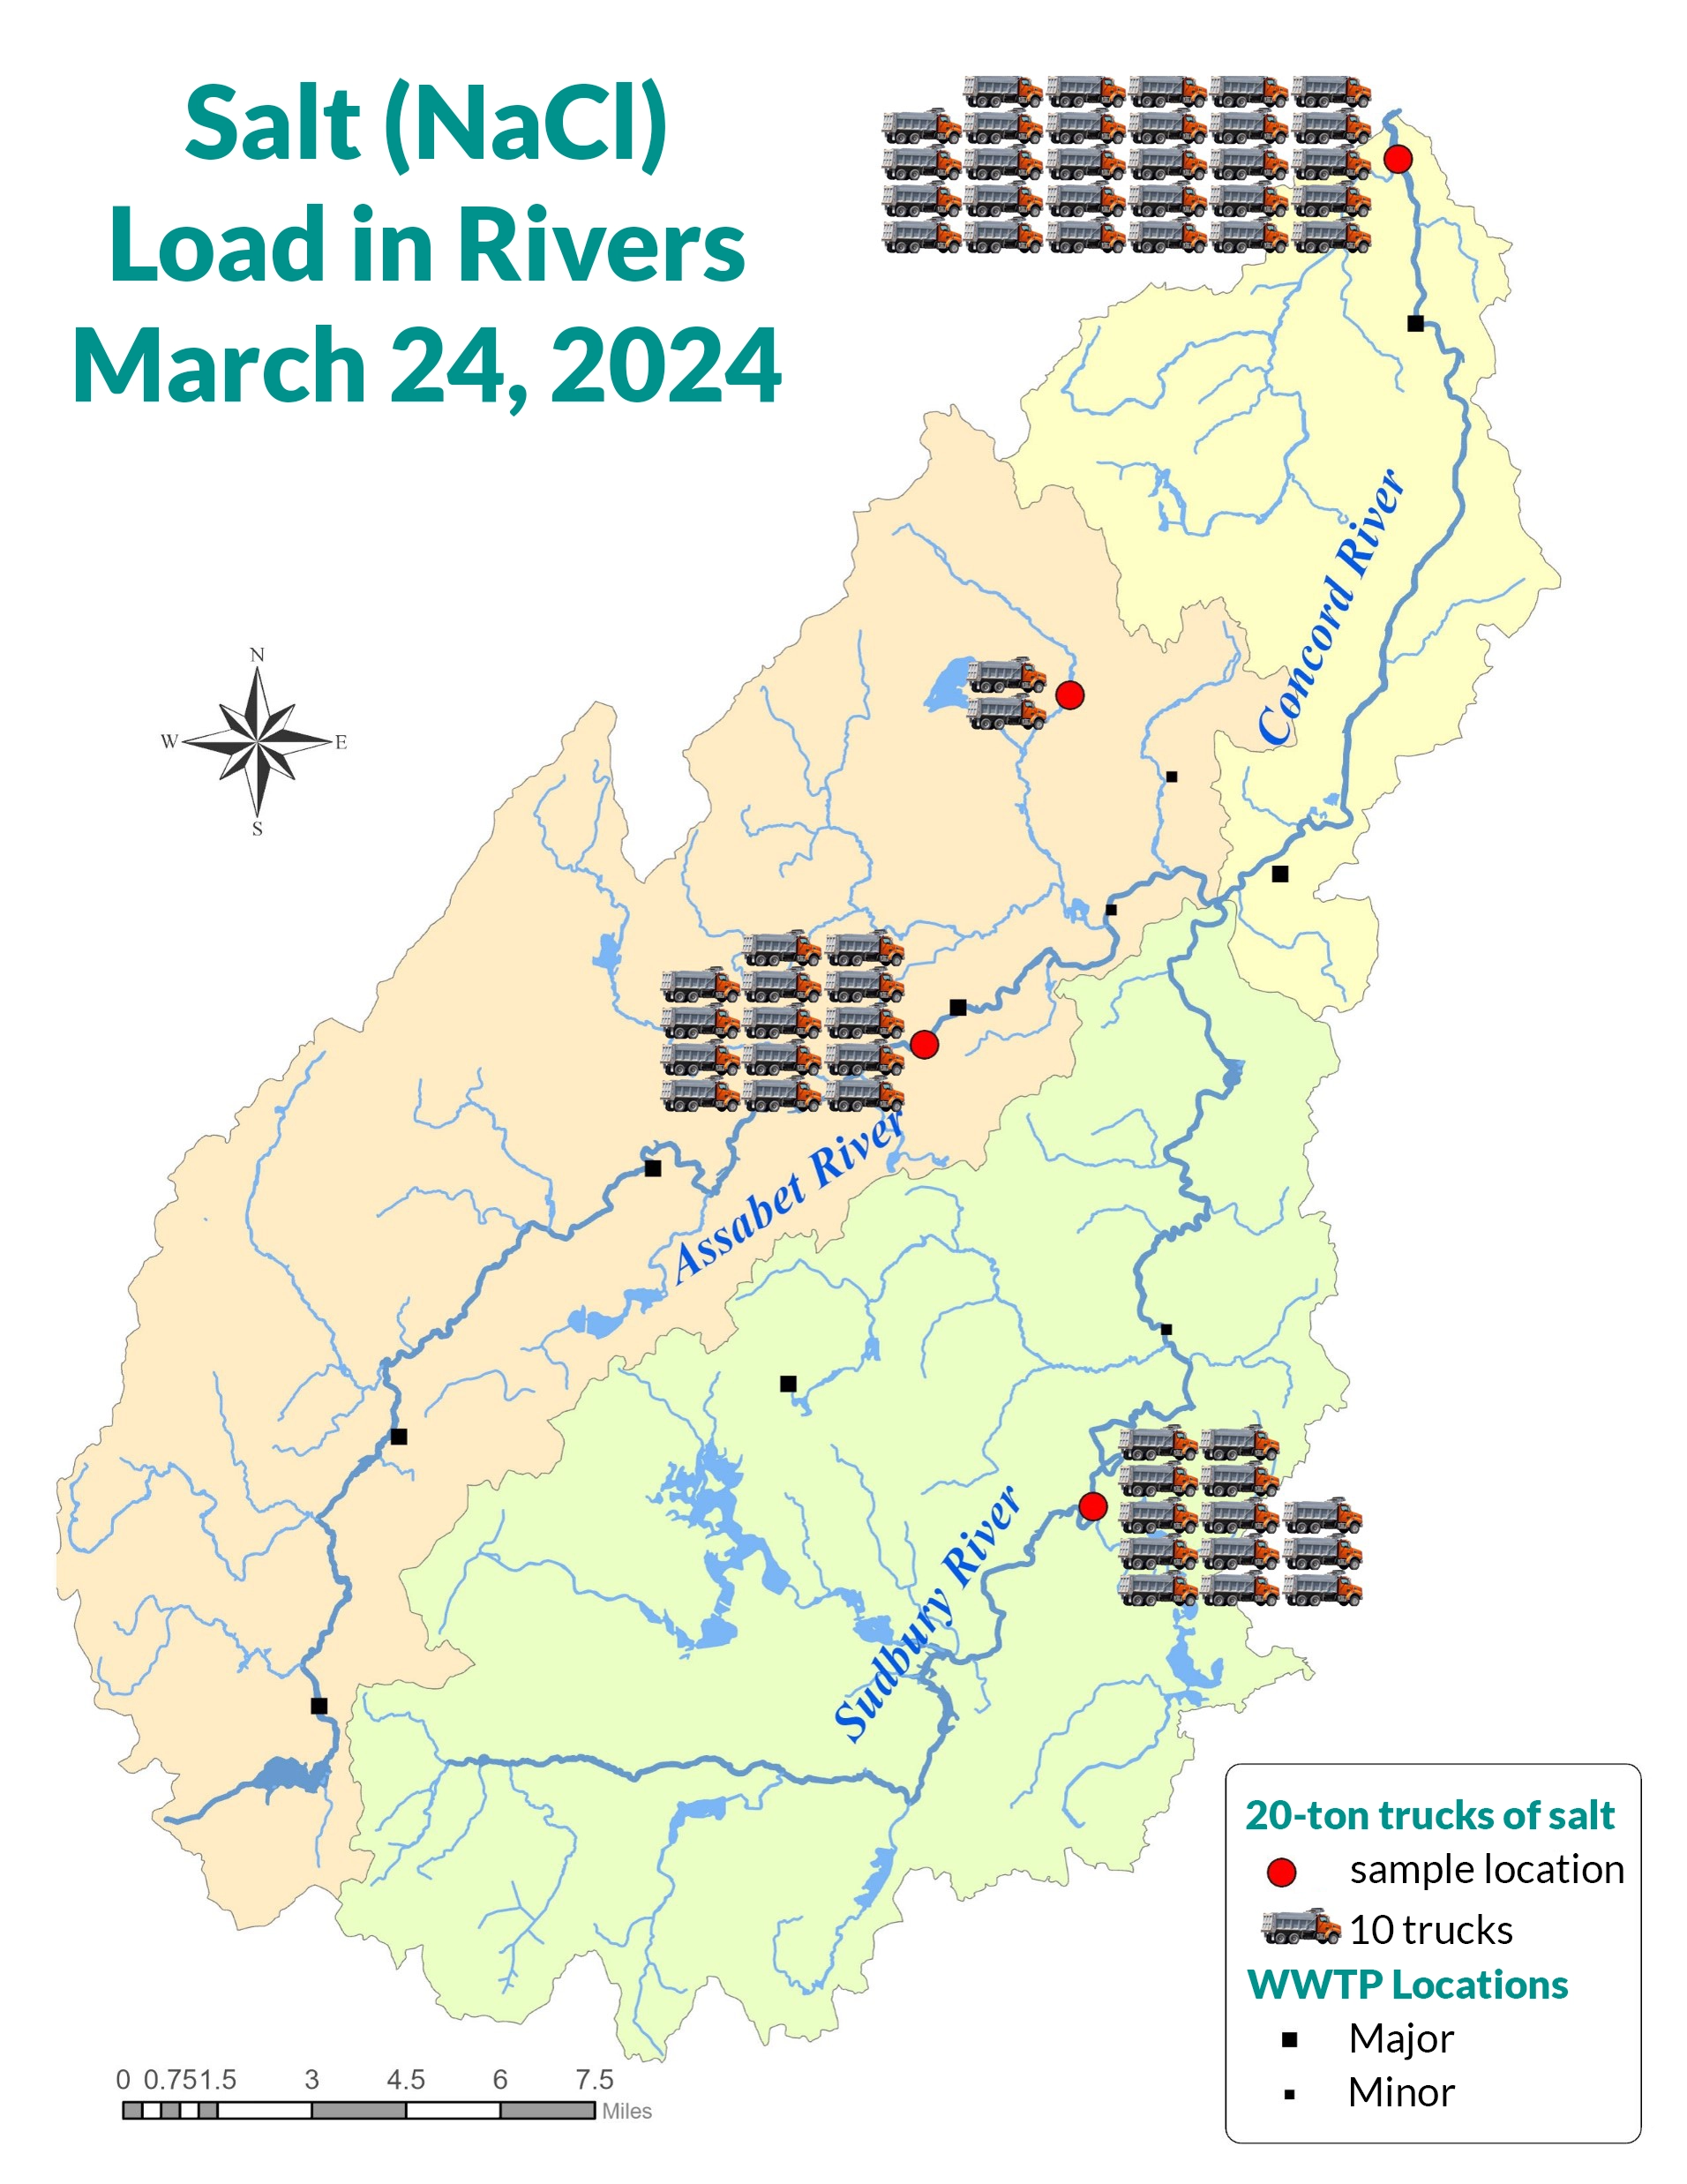
Samples were collected on March 24th and analyzed for chloride at two sampling locations in the Sudbury and Assabet rivers. These two locations in Maynard and Saxonville also have real-time flow gauges (maintained by the US Geological Survey, USGS) that provide very accurate estimates of river flow volumes at the time of our sampling. With this information about chloride concentration and river flow volume, we calculated the total mass of salt being carried in dissolved form downstream. The total mass carried downstream in 24 hours can be referred to as the daily salt load. Based on our calculations, we estimate that the 24-hour salt load on March 24th at the Assabet River Maynard site was equivalent to 135 20-ton trucks of salt. At the Sudbury River Saxonville site, it was equivalent to 131 trucks of salt (see Figure 3). OARS also documented a very reliable correlation between the electrical conductivity of the water (which we measure at all sites) and chloride concentration, so we can estimate chloride concentration at the other sites we sampled even without analyzing the samples for chloride. Two other sampling sites have USGS flow gauges, allowing us to calculate load in the Concord River in Lowell and Nashoba Brook in Acton. Based on our conductivity-chloride model, we estimate that the salt load at the Concord River Lowell site was equivalent to 288 trucks of salt and 15 trucks of salt at the Nashoba Brook Acton site (see Figure 3).

Is all of this salt really necessary? How can each of us help reduce the salt we are distributing?

