Studying Dissolved Oxygen in the Talbot Impoundment
July 11, 2024
July 25, 2024
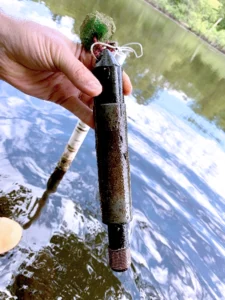
It was lucky that we continued our Talbot Mills impoundment dissolved oxygen study for a second year because the two years demonstrated very different dissolved oxygen dynamics. We deployed a data logger in the impounded area of the Concord River upstream of the Talbot Mills dam for four months in the summers of 2022 and 2023. The logger recorded dissolved oxygen continuously every 15 minutes.
The summer of 2022 was very dry, with almost the second-lowest amount of rainfall in more than 20 years. River flows were very low for most of the season, and the primary driver of dissolved oxygen (DO) in the impoundment was in-stream photosynthesis from plant life. In contrast, the summer of 2023 was very wet, with the highest amount of rainfall in more than 20 years. River flows were at flood level for most of the summer, and the primary driver of DO was flow. Photosynthesis was generally insignificant as a driver of DO in 2023.
Dissolved oxygen is required for fish and aquatic organisms to survive. If it is too low, below 3 mg/L (Mass DEP Aquatic Life threshold for Class B waters), fish will suffocate because they can’t extract enough oxygen from the water. If it is too high, significantly above 100% of equilibrium saturation, gas bubbles can form on fish gills, causing infections. In 2023 (Figure 1), DO concentrations were always above 5 mg/L, and the primary concern raised by the logger data was that DO concentrations exceeded 150% of equilibrium saturation (> 12 mg/L) multiple times during the summer. In contrast, in 2022 (Figure 2), DO concentrations were below 5 mg/L for almost all of the summer, and the logger data showed that concentrations fell below 1 mg/L multiple times during the summer.
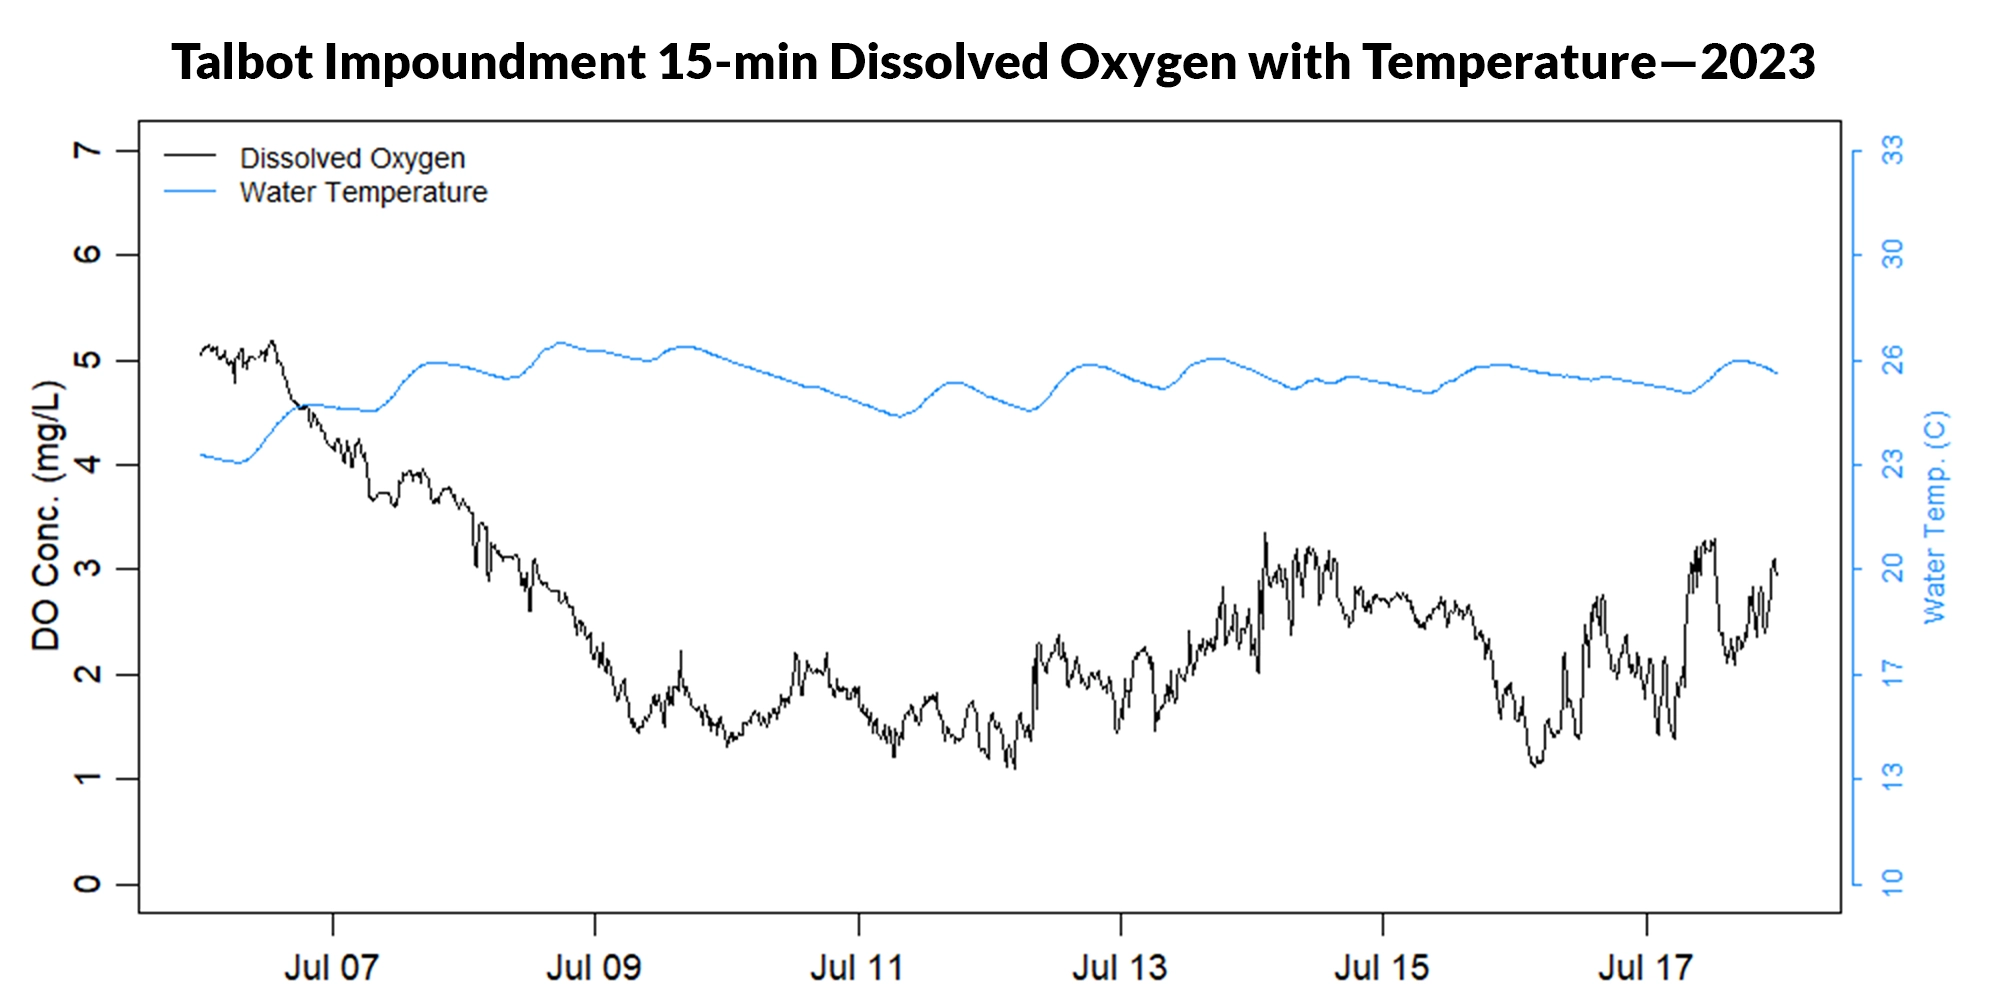
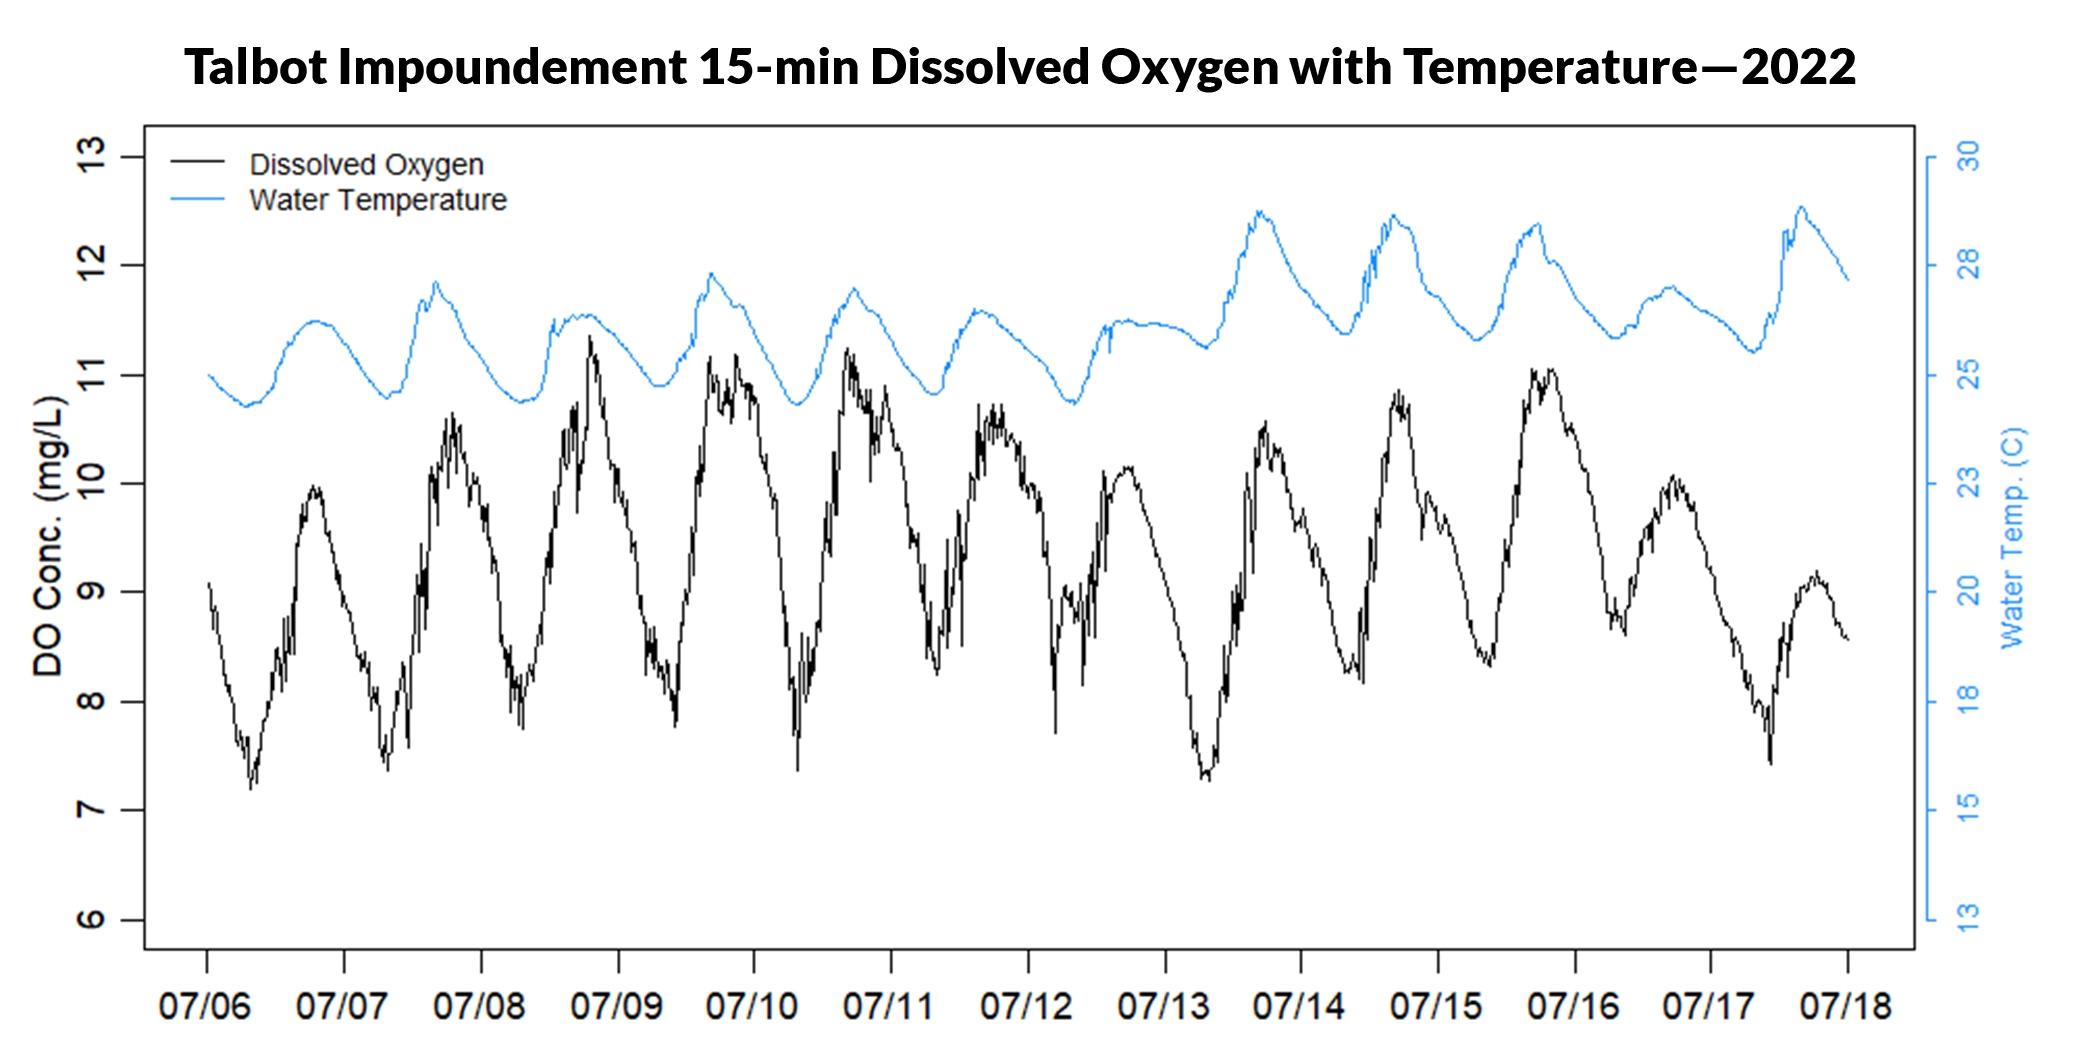
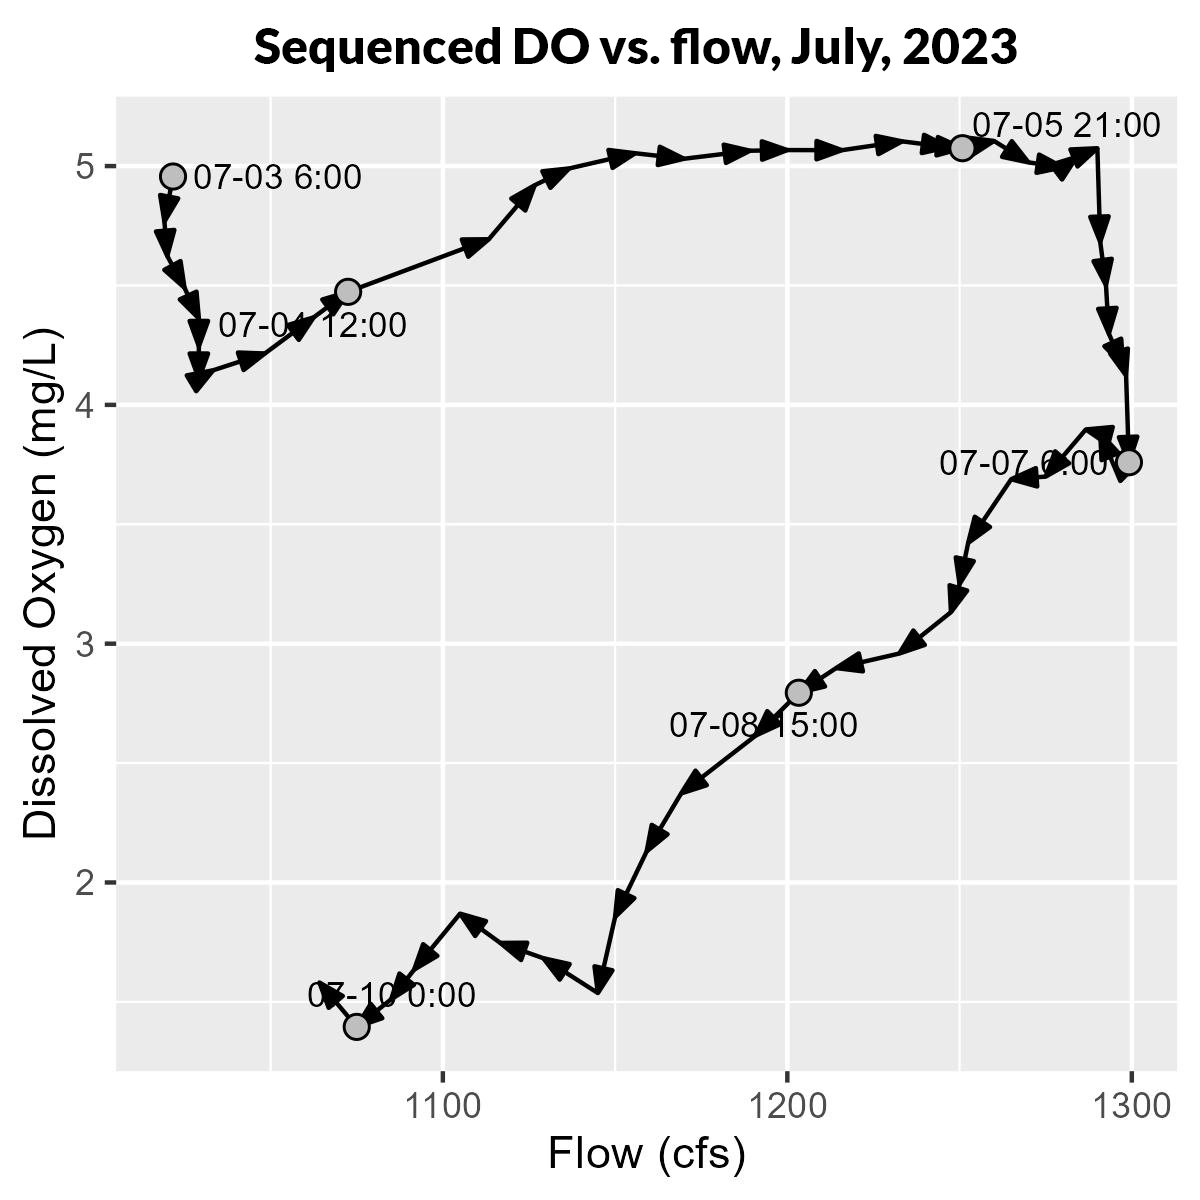
Comparing DO and flow (Figure 3) accentuates the very different DO dynamics related to different flow regimes of the two years. When flow was low in 2022, DO levels were high and primarily driven by photosynthesis cycles. When flow was high in 2023, the daily photosynthesis cycles were negligible, and DO was very low. Our hypothesis is that high flows caused the river to overtop its banks, collecting organic matter from the floodplains. The decomposition of organic matter in the floodplains consumed dissolved oxygen in the water.
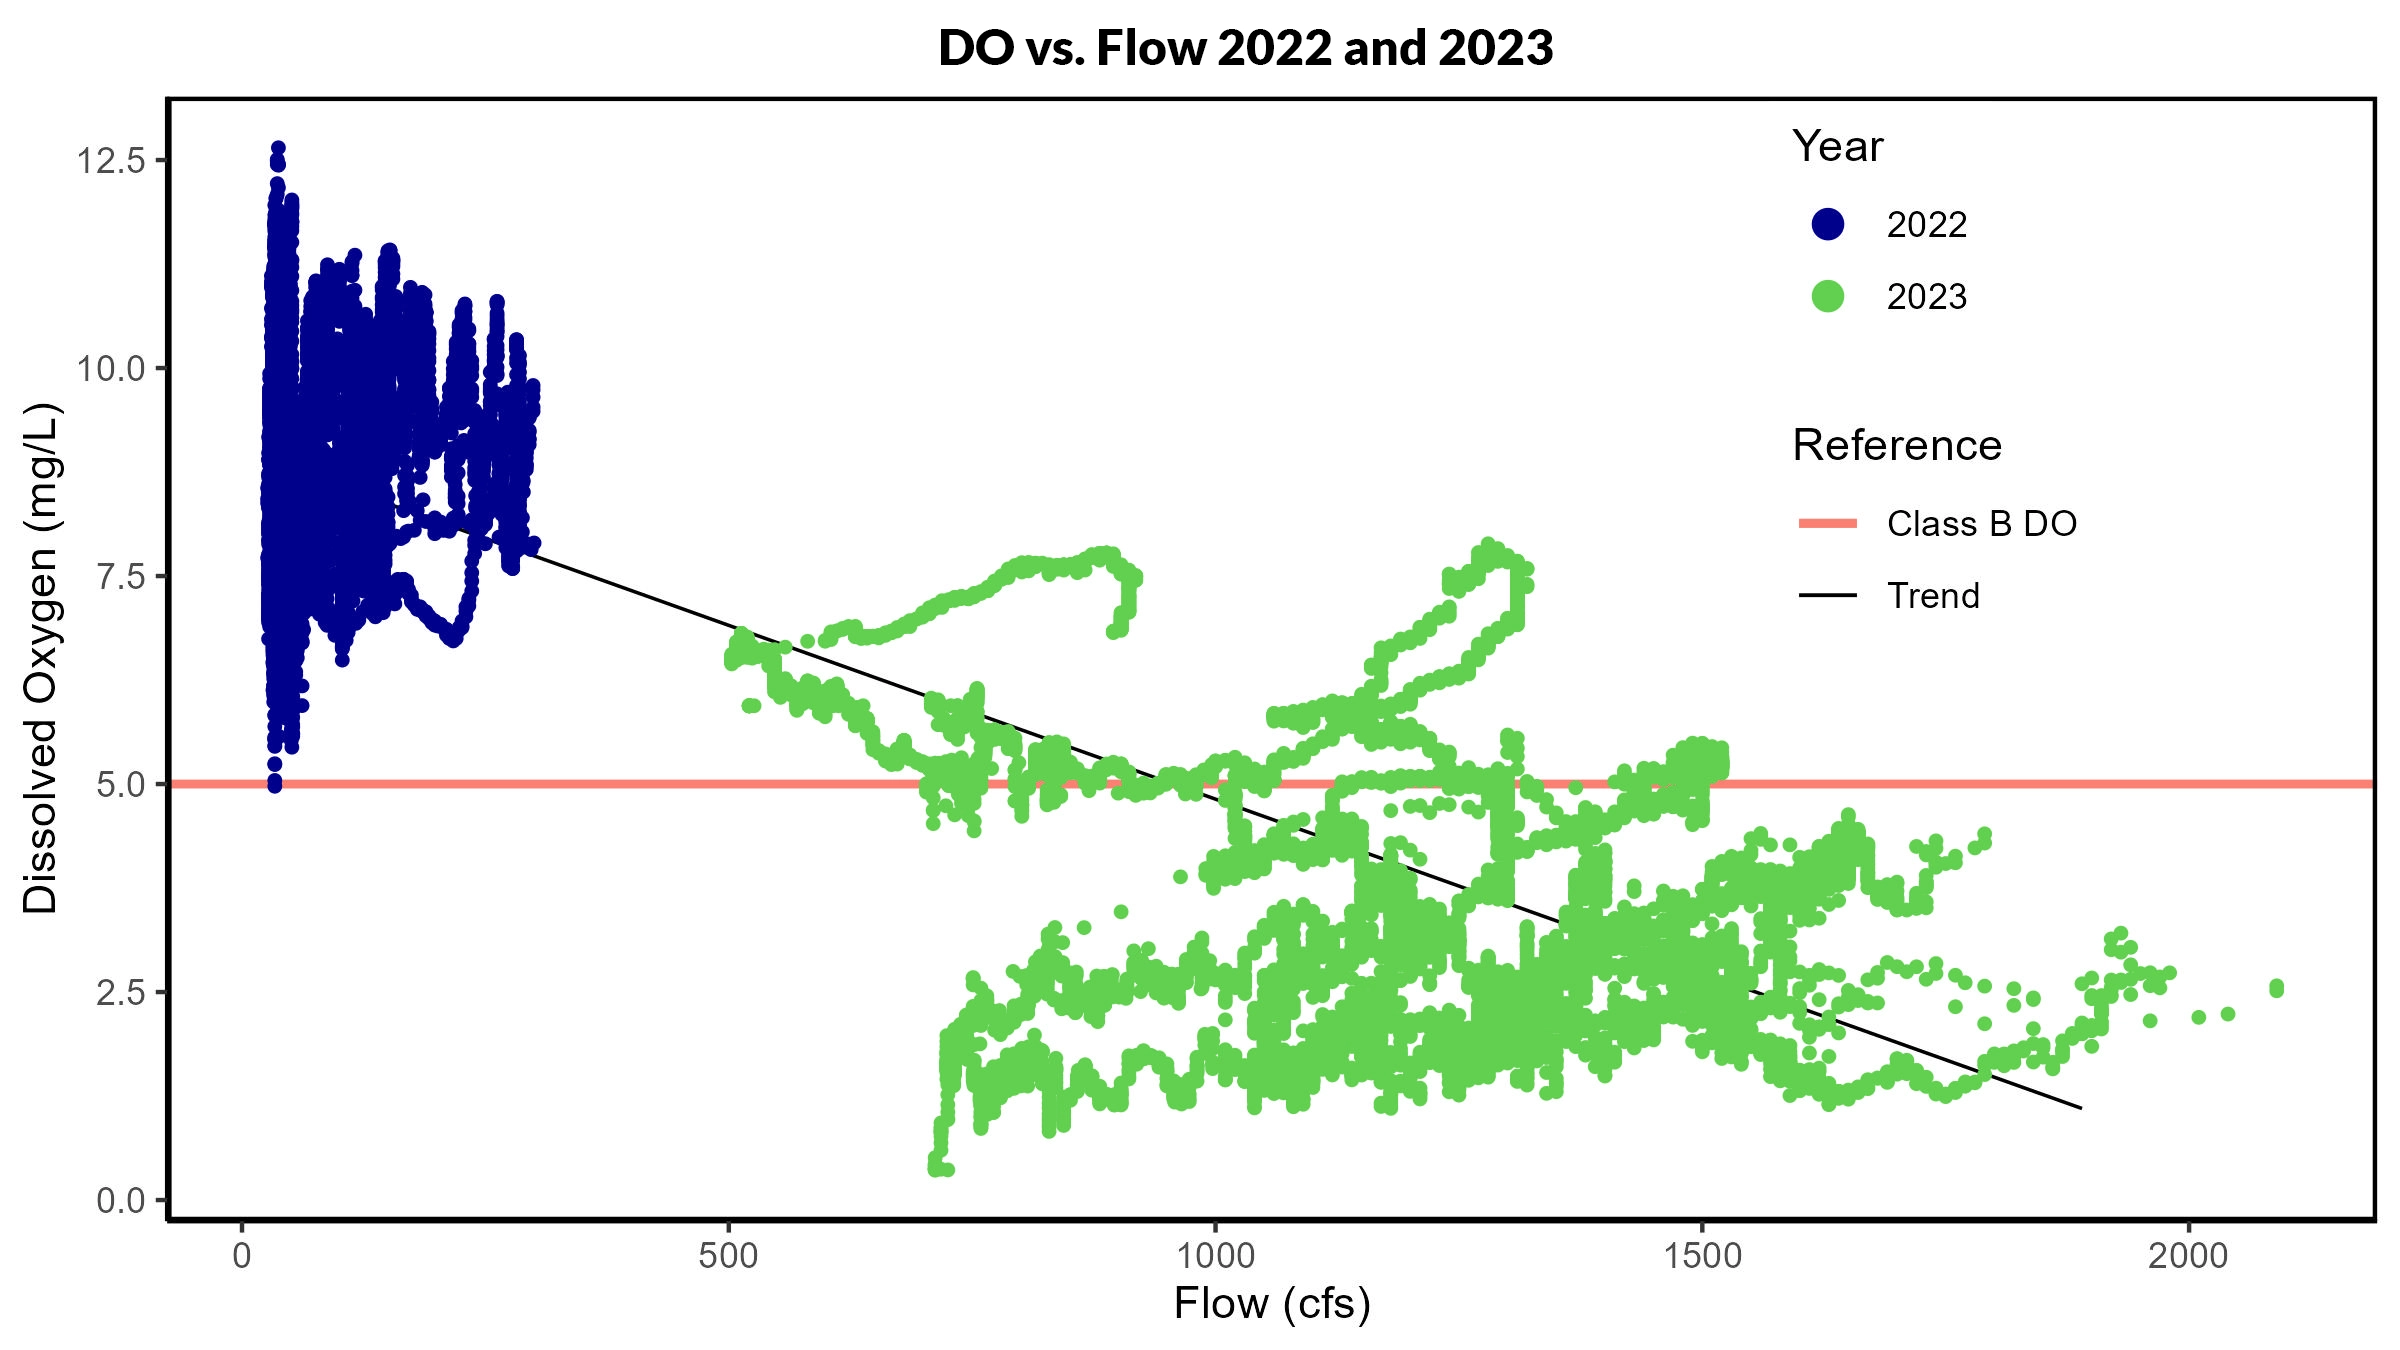
The dominant pattern we saw between DO and flow in 2023 (Figure 4) with sequenced data for a 7-day period in July. Increases in flow brought fresh oxygenated water, but as soon as flow stabilized and started to fall, the oxygen was quickly consumed by decomposing matter washed into the river from the floodplains.
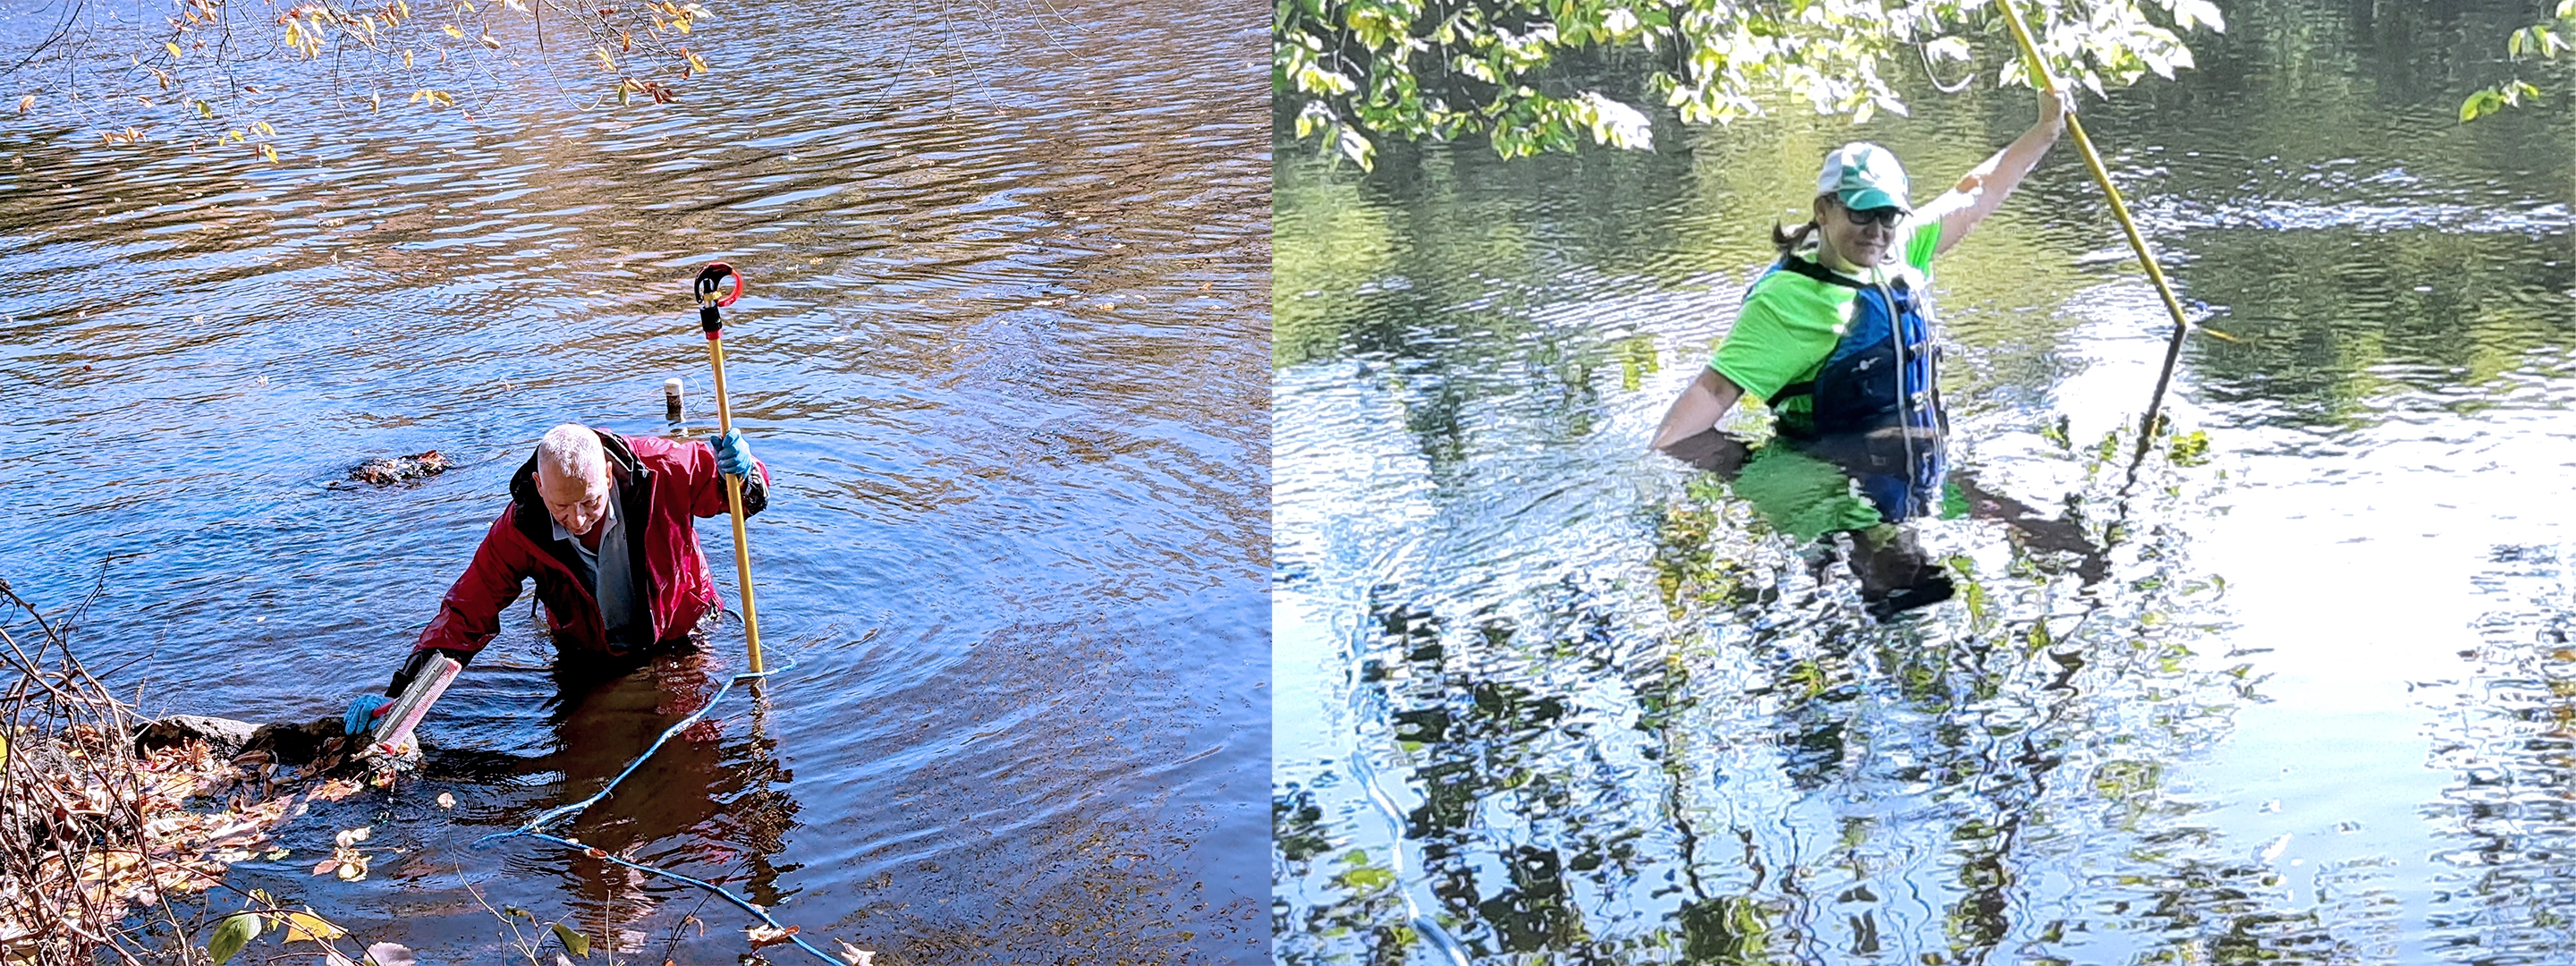
Thanks to volunteers Marlies Henderson, Len Rappoli, and Amanda Brandt for helping to clean the logger. And thanks to the Billerica Highway Department for allowing us to access the logger from their property.